import streamlit as st
import pandas as pd
import pygwalker as pyg
import streamlit.components.v1 as components

def main():
    st.set_page_config(layout="wide")
    custom_css = """
    <style>
    body {
        margin-top: 1px;
    }
    </style>
    """
    st.markdown(custom_css, unsafe_allow_html=True)
    data_input()
    data_output()

def data_input():
    # Use Streamlit widgets in the sidebar to get user input
    uploaded_file = st.sidebar.file_uploader("Upload a CSV file", type=["csv"])

    # Process the uploaded file if it exists
    if uploaded_file is not None:
        df = pd.read_csv(uploaded_file)
        st.session_state['uploaded_df'] = df

def data_output():
    if 'uploaded_df' in st.session_state:
        df = st.session_state['uploaded_df']
        pyg_html = pyg.walk(df, return_html=True)
        components.html(pyg_html, height= 1000,  scrolling=True)


if __name__ == "__main__":
main()Tableau is used for data visualization and business intelligence, helping users analyze and explore data through interactive visualizations. Its user-friendly interface and data connectivity allow for easy exploration of various data sources, while dashboards and data stories enable effective communication of insights. With scalability and advanced analytics capabilities, Tableau is a powerful tool for organizations to make data-driven decisions and gain valuable insights from their data.
It a separate application to doing this but some times we are need inside our python application or jupyter notebook, streamlit or any other python application framework.
As a data analyst main work to do
- Finding results as per business problems using business data.
- Solving research problems in a study using capture data.
- Curiosity about finding inside in a data set or multiple data sets.
- Pattern finding and model fitting based on the data.
All of them are easily recognized based on the graphical representation based on selected appropriate selecting feature (variable) and manipulation.
Streamlit application
Streamlit is a Python library used to create web applications for data science and machine learning projects. With just a few lines of code, developers can transform data scripts into interactive web apps. It simplifies the process of sharing and visualizing data, making it an efficient and user-friendly tool for data scientists and developers to showcase their work and engage with end-users interactively.
Here we are creating a python streamlit application using pygwalker.
It is a good practice to creating separate for all the project and inside folder creating and storing all necessary files. For this project creating a folder tableauLite inside this folders crating two files app.py and requirements.txt inside requirements.txt file write pandas, streamlit and pygwalker.
Open anaconda prompt set this file location and run the code pip install -r requirements.txt (all files are upload my github page)
Now open our main app.py files and copy past this code otherwise download this file in my github page to direct run the code.
Finally we have necessary files now open teminal and run streamlit run app.py it will start a local web server and provide you with a local URL http://localhost:8501. Open the web browser and enter this URL to access our Streamlit application.
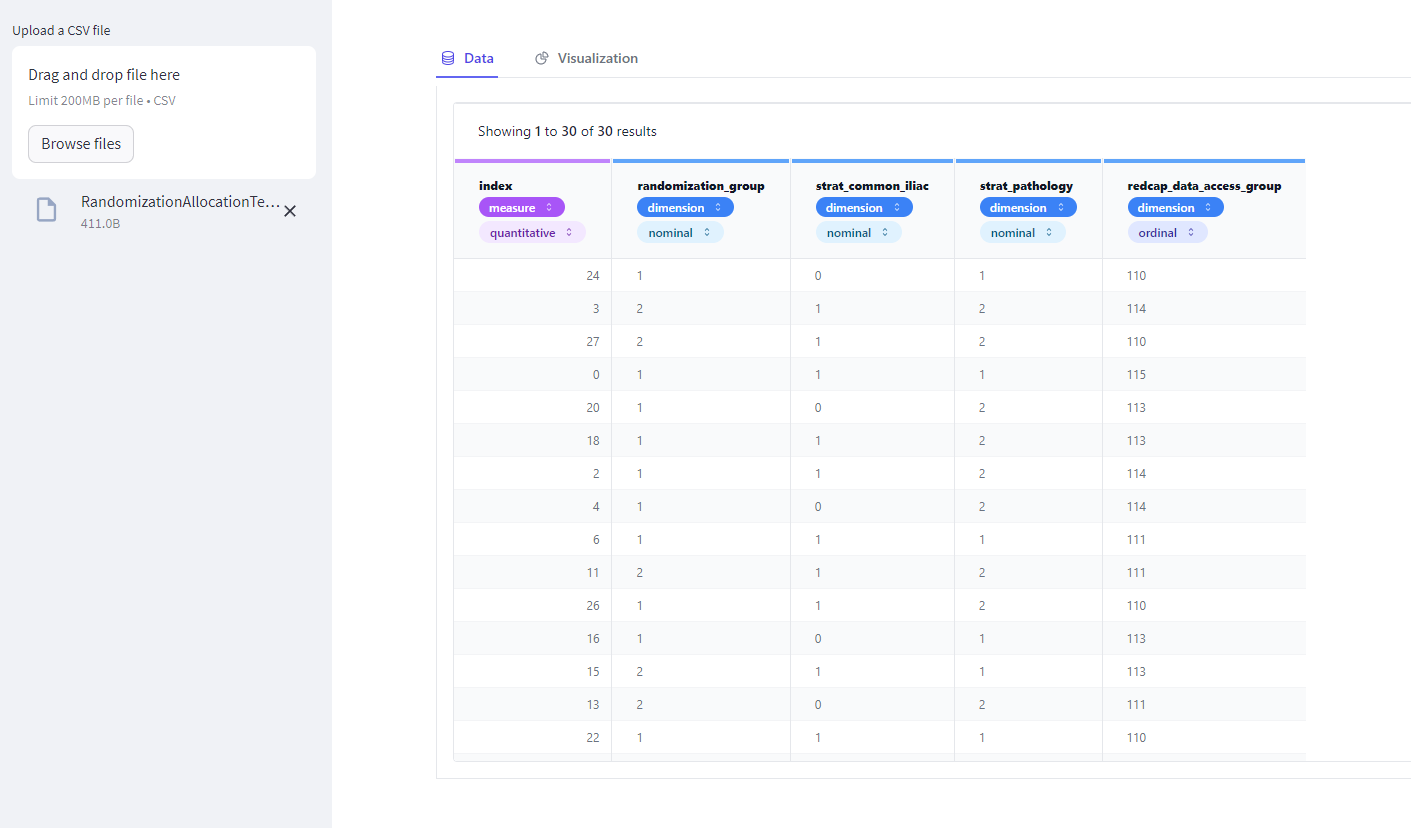
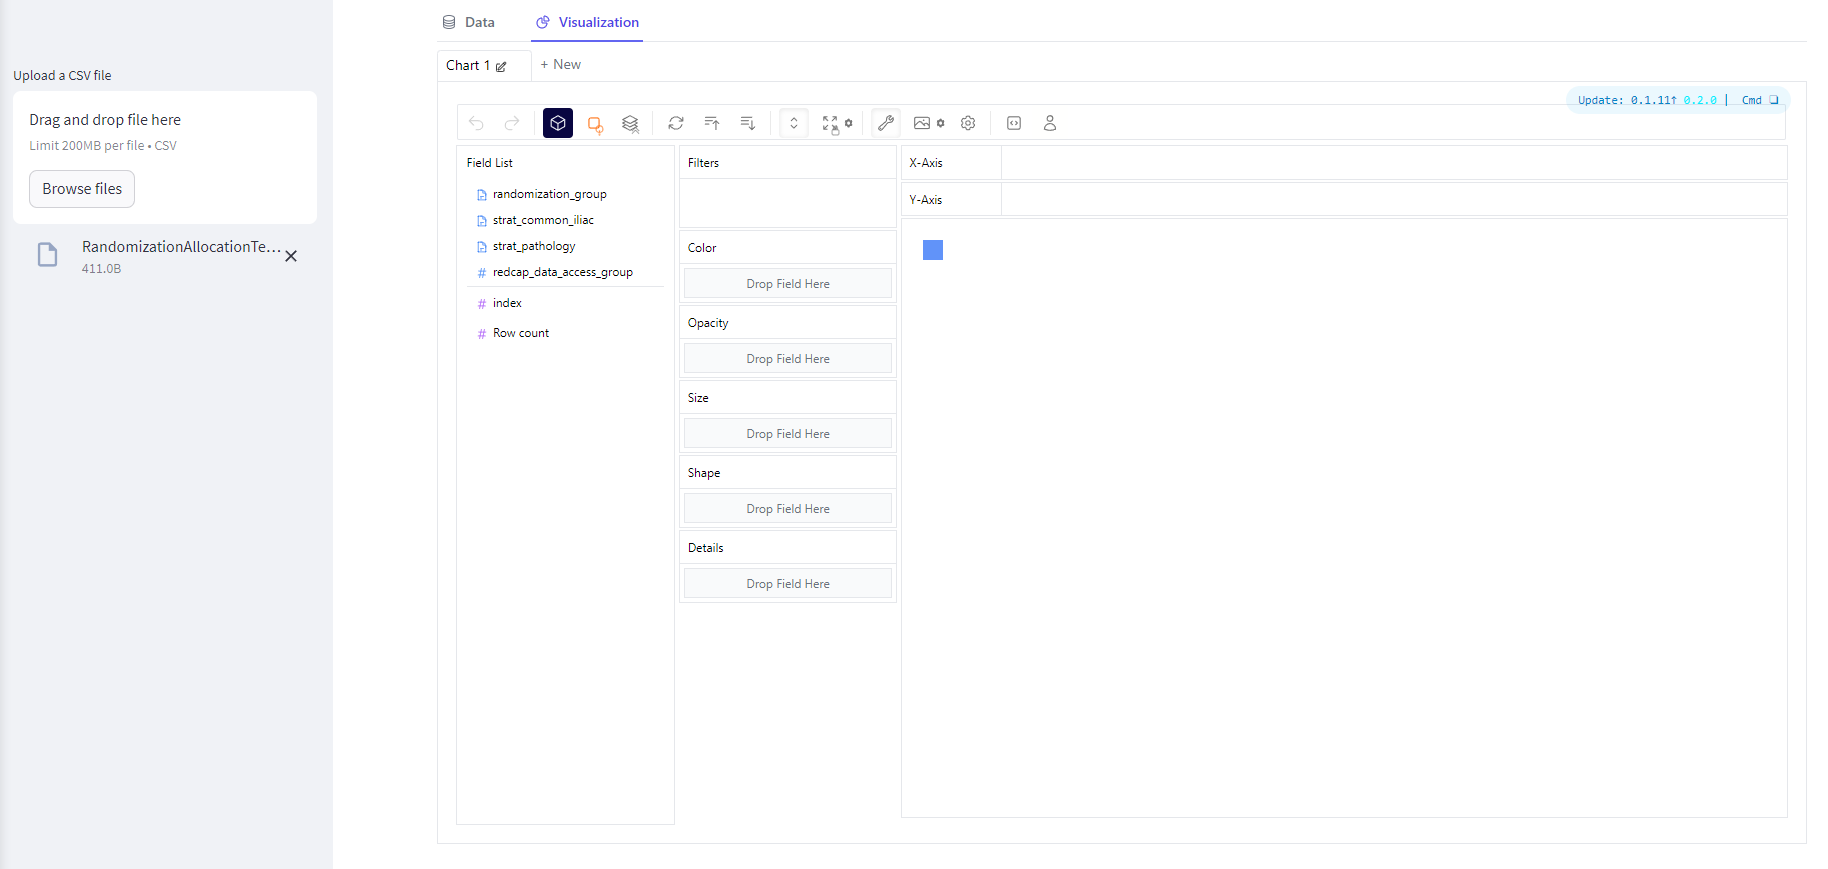
In general now this version two tabs one is Data and another is Visualization.
Visualization Tab
Data Tab